Posts Tagged ‘research methods’

TOWIED

Sunday, January 27th, 2013

“conversations of everyday life… with structure and purpose that are defined and controlled by the researcher.”

Steinar Kvale on qualitative research interviewing (1996)


“real people in modified situations, saying unscripted lines but in a structured way.”

Grace Dent on The Only Way Is Essex (2010)


Twitter Timelines and the Art of Skim

Wednesday, November 21st, 2012

I’ve commented previously on how sites like Twitter provide researchers with explicit interactions and user relationships that lend themselves to network-based data mining methods and visual analytics. These help us understand frequencies and patterns of use up to a point, but fall short in indicating the complex, inconsistent and selective viewing behaviours and strategies that underpin how we actually engage with Twitter.

These are partly determined by how we access Twitter, and how we may adopt ‘filtering’ systems (within Twitter and third-party). But what I’m particularly interested in here is how we ‘scan’ or ‘skim read’ our Twitter timelines. When new users express concern about the apparent content overload, experienced users tend to reassure them by explaining they don’t have to ‘read everything’ and that they will ‘get used to’ scanning tweets. It’s fairly clear why we do this, but how?

Observational methods (remotely or through screen recordings) can provide limited data, but for a more accurate insight, eye-tracking technology can record how we actually ‘read’ sites like Twitter, as demonstrated here. Supplementary methods such as the think/talk-aloud protocols associated with usability testing, and follow-up memory tests might offer opportunities for triangulation.

I’m not experienced in these tools, or familiar with how they are being used in research, and I would question how much the ‘laboratory’ conditions in which these types of investigations are typically undertaken reflect everyday use. But it is interesting to speculate on the contribution they can make to our understanding of user engagement with Twitter. Given such an approach, the type of questions one could explore might include:

  • How much consistency / variation in skim reading do we exhibit over different periods of engagement?
  • Do we navigate tweets in a generally (reverse) chronological order or more randomly?
  • How ‘far back’ do we check tweets since we last looked?
  • What are our dominant focal points – specific users or specific content?
  • How much do we focus on specific components – in particular URLs, hashtags?
  • How important is the colour coding of these components?
  • Do we focus more on specific types of tweets (e.g. those with links)?
  • Do we notice specific words or terms (that are not hashtagged)?
  • What about capital letters, symbols, exclamation marks, expletives etc?
  • Do we primarily identify our followees by their user names or avatars?
  • Are some (types of) avatars more instantly recognisable?
  • How much does the unfamiliarity of original authors of formal retweets (not RTs) attract our attention?
  • Do we take much notice of who retweets them?
  • Are we more likely to ignore multiple tweets from excessive users?

Using Evernote for Participant Reporting

Wednesday, July 20th, 2011

It has been necessary in my PhD research to track my participants’ ‘off-radar’ social media activities. This is the term I use to describe any active contribution to sites that I am not routinely observing – such as commenting on a blog I am not following. My participants took on the responsibility of reporting such activities, and some found it useful to use Evernote.

Evernote is a private online annotation tool that enables the user to ‘grab’ specific content (such as a paragraph of text or an image) from web pages, and collect them on a personal site as ‘notes’ stored in folders called notebooks. Evernote also enables users to set up confidential links through its shared notebooks facility.

Not all my participants chose to use Evernote, preferring instead to keep a log or simply e-mail updates. But those that did generally found it a quick and unobtrusive method of self-reporting, and one participant adopted it into her everyday practice.

Here’s a guide for researchers who may want to use it in this way:

Set up

The researcher and each of the participants will need to first sign up at http://www.evernote.com/

Click the Create Account button, complete the Register for Evernote panel and follow instructions. Evernote is free for a monthly upload allowance of 60mb.

Create a Notebook

Each participant will need to set up a notebook for all the content they specifically want to share with the researcher.
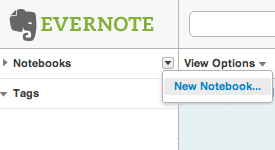
In the Notebooks panel (top left), select New Notebook and give it a name
(They can set up as many notebooks as they want for other purposes if they wish.)

To save files

The easiest way for participants to save content to Evernote is using the Web Clipper tool. This is a simple ‘bookmarklet’ that adds a button to the browser toolbar (Evernote supports Internet Explorer, Firefox, Safari and Chrome). To set this up, they need to go to:

http://www.evernote.com/about/download/web_clipper.php

Once this is set up, participants can simply highlight any content on a web page and click the Evernote button. They do not need to have their Evernote site open at the time, but the next time they view it they will see the content has been added as a note.

To share Evernote notes

This is the set up procedure for participants to allow the researcher to access the notes they wish to share. They will only need to do this once:
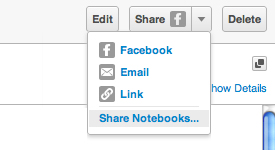
In the Share drop down menu (top right), click on Share Notebooks…
In the Notebook Sharing panel, click the Start Sharing button next to the notebook to be used for the research
In the Share with individuals panel, select Invite individuals to access this notebook
In the Email invitations to box, type in the researcher’s e-mail
Under the heading Recipients may:, select View this notebook
Keep the Require log in to Evernote box ticked
Click the Send invitations button

Some alternatives to Evernote can be found here.

Presenting Research Data and Information

Wednesday, May 4th, 2011

Yesterday I attended Warren Pearce and Nicola Underdown’s enjoyable and informative workshop on data presentation at the Jubilee Graduate Centre. Whilst I doubt I will be using any quantitative data in my thesis, there was plenty here to take away for future reference.

Warren talked about the ‘curse of knowledge,’ and demonstrated how our assumptions of audience understanding can affect the process of communicating information. He recommended Made to Stick, a useful looking book by the Heath Brothers on communicating ideas, as well as the ‘bible’ of statistical graphics by Edward Tufte, which has helped establish some of the key principles of visual communication.

Nicola introduced the acronym LATCH, to describe the fundamental elements on which different presentational figures (graphs, charts etc.) are based: Location, Alphabet. Time, Category and Hierarchy, and discussed the importance of context, describing how the interaction of the author in environments related with different dissemination formats (paper, poster, presentation etc.) influences audience understanding.

Overall, this was a great introduction to an element of research dissemination that is often overlooked and undervalued. There has been such a good response that Warren and Nicola are running the workshop again next week. They’ve also set up an excellent online resource at http://effcomm.posterous.com/