Posts Tagged ‘visualization’

Visualizing Social Bookmarks

Sunday, January 11th, 2009
calibrate

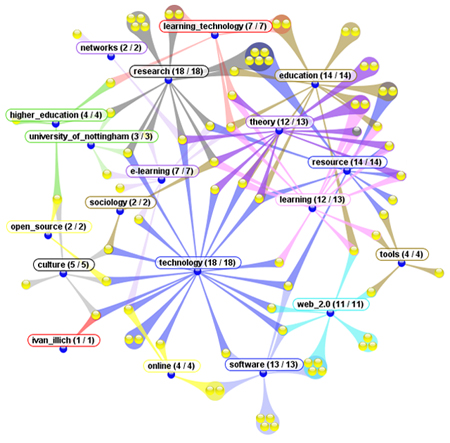
This is just a small part of my Delicious site as interpreted by the CALIBRATE visualization programme developed by Joris Klerkx in the Department of Computer Science at Katholieke Universiteit Leuven. The tool identifies and presents tag and community (multiple-user) relational structures using cluster mapping, and integrates a list view and frequency filter. In a paper just published online in the Journal of Digital Information, Klerkx and Erik Duval describe the development of the programme and present results from ‘Think Aloud’ user testing and post-experimental questionnaires. You can download the software and view a demo video here.

Reference

Klerkx, J. & E. Duval, E. (2009). Visualising Social Bookmarks. Journal of Digital Information, 10(2).
Citation Mapping

Sunday, December 14th, 2008

In a paper published earlier this year, Malcolm Tight explores the theoretical ideas around commonalities in the approaches of communities of practice and Becher’s academic tribes and territories. He conducts a co-citation analysis of Higher Education research journals; focusing on author identities and locations, themes, theories and analyses, methods and methodologies, presenting a rudimentary diagrammatical representation of his analytical modelling.

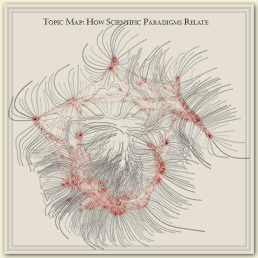
Similar notions of ‘citation mapping’ have been explored elsewhere, particularly in the natural sciences, and a version has recently been introduced to the citation and journal database ISI Web of Science. And Interactive Designer W. Bradford Paley’s visualization of 800,000 scientific papers uses author citations to explore the interconnections between science paradigms.

topic_map

Reference

Tight, M. (2008). Higher education research as tribe, territory and/or community: a co-citation analysis. Higher Education. 55, 593-605.

Digg Labs

Tuesday, October 28th, 2008

My favourite website at the moment is digg labs. Providing a ‘broader (and deeper) view’ of Digg activity, it presents 5 visualization formats of real-time activity. Design-wise, this is amongst the most effective info-viz sites I’ve come across, and offers a glimse of how we may browse our social bookmarking and networking sites in the future.